Monitoring the health of aquatic ecosystems can effectively begin on campus by testing drinking and usable water. Regular assessments of water quality indicators such as pH, turbidity, dissolved oxygen, temperature, and contaminants like heavy metals, nitrates, and microplastics provide insights into the broader environmental conditions of nearby aquatic systems. Incorporating biodiversity assessments, such as analyzing plankton or microbial communities, further reveals ecosystem imbalances or potential pollution.
These findings can be linked to the health of nearby wells, rivers, or lakes, as campus water sources often reflect the state of surrounding ecosystems.
The evaluations of aquatic ecosystems near Universitas Gadjah Mada are guided by regional and national regulations. As part of its Campus Environmental Monitoring Plan (RKL), UGM regularly reports the test results of river water quality and lake water quality from water sources inside and near the campus area. These assessments, conducted by experts from the UGM Center for Environmental Studies, adhere to the Ministry of Health Regulation Number 2 Year 2023, implementing Government Regulation Number 66 Year 2014 on Environmental Health.
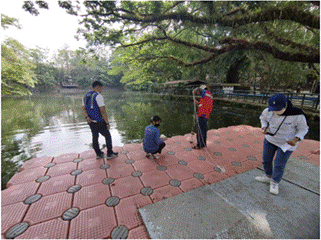
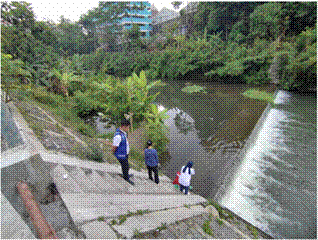
Each semester, teams of researchers and students regularly test key water sources, including the lake in UGM Valley, shallow wells near faculty buildings, and the Belik and Code Rivers. In 2023, UGM expanded the scope of its monitoring efforts to include broader pollution indicators, enabling the university to track water health trends and identify emerging environmental concerns over time. The images below are UGM researches and students conducting water quality control for the UGM Valley Lake and the upstream Code River.


Engaging students and staff in the testing process not only raises awareness about water conservation but also fosters a sense of environmental stewardship. Universitas Gadjah Mada has taken decisive action in this regard and shares results with stakeholders and developing actionable plans for pollution mitigation and resource management to ensure a proactive approach to maintaining the health of aquatic ecosystems.
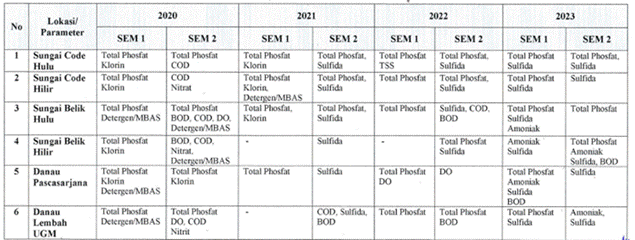
The accompanying table depicts the water quality monitoring data from various locations collected between the years 2020 and 2023. These locations include different water bodies, such as rivers and lakes, in and around UGM’s main campus in Yogyakarta, Indonesia. The table is organized by year and semester (SEM 1 and SEM 2), detailing the parameters measured at each site.

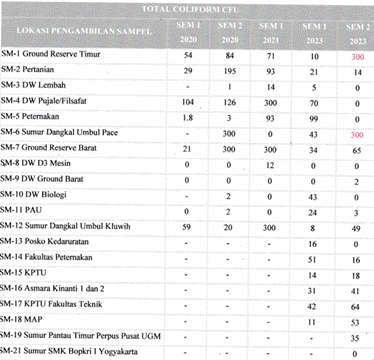
The monitoring process includes collecting data on total coliform counts (measured in CFU—colony-forming units) from various water sampling locations at UGM over different semesters from 2020 to 2023. This data serves as a critical indicator for monitoring water quality and safety, highlighting potential contamination and identifying areas requiring intervention or further investigation to ensure environmental health.

The water quality at UGM reflects a well-maintained aquatic ecosystem, proven by pollution levels that are effectively controlled. Further details on test results for drinking water sources, lakes, and rivers in the UGM campus area can be found on the UGM Preventing water system pollution website.
References:
