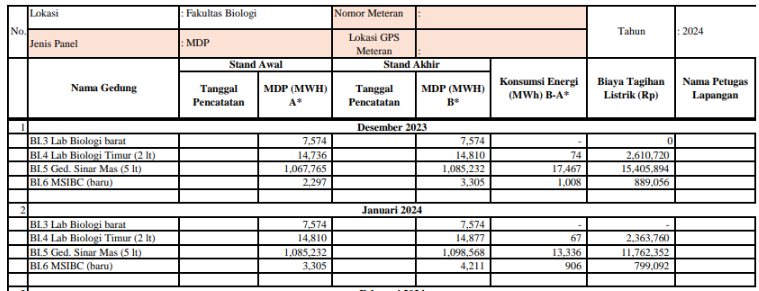
At Universitas Gadjah Mada (UGM), three methods are employed for recording electricity consumption: the conventional approach, the university’s Smart Building monitoring system, and the Building Energy Monitoring System (BEMS).
Several newer buildings are equipped with the BEMS automated systems integrated into a centralised dashboard. UGM has been in the implementation and evaluation phase of this system for the past four years, continually refining it. Monitoring electricity usage via the dashboard (see below) is proven to be highly effective and efficient, enabling precise tracking of energy consumption at various levels, such as by building, floor, or department.
The dashboard plays a crucial role in identifying energy usage patterns, helping to categorise buildings based on their energy efficiency. It serves as a preventive tool, flagging buildings that may be consuming excessive electricity or those operating within energy-saving standards. This granular insight helps identify areas with the highest energy waste, facilitating targeted interventions to improve efficiency. Each faculty has access to monitor their energy consumption data in real-time, allowing for proactive energy management.

BEMS has only been implemented in several buildings at UGM thus far. Meanwhile, all buildings at UGM are already integrated with the university’s Smart Building monitoring system (see https://smartbuilding.wg.ugm.ac.id/#!/). This system is able to provide real-time data on energy supply and demand across faculties. By clicking one of the faculties listed on the website, one can see the energy supply and demand of each faculty building. The dashboard visually maps buildings, enabling easy identification of energy usage patterns. This tool supports energy efficiency initiatives by highlighting high-demand areas and guiding sustainable energy management efforts in line with UGM’s green campus goals. This data is made available to the public. Each building is labelled with its area and energy demand, with usage levels categorised by colour: green (<90%), yellow (90–95%), and red (>95%).
For instance, in the figure below, the DTMI and DTSL buildings in the Faculty of Engineering have energy demands of 7,436 kWh and 15,373 kWh, respectively, both marked in green, reflecting efficient energy usage. Meanwhile, DTNTF, with a demand of 13,415 kWh, also remains within acceptable levels. The monitoring system can be used to alert which buildings have high energy usage that must be controlled, such as the DTAP building that is in the red category, with a demand of 22,328 kWh.

If an increase in electricity consumption is not caused by energy waste but rather by changes in activities or business processes within each faculty, it requires a different perspective for analysis.
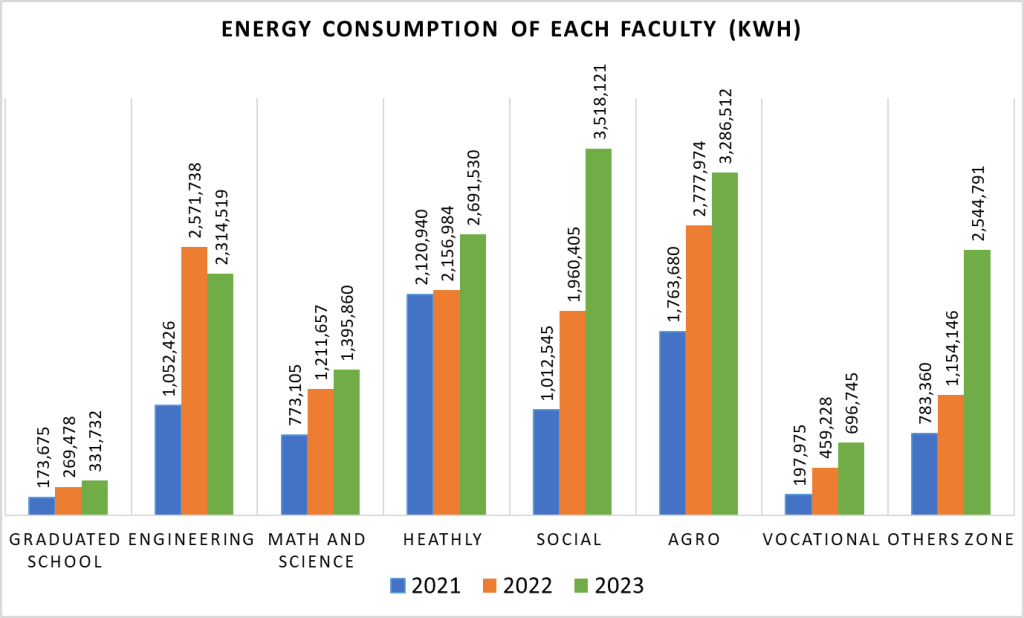
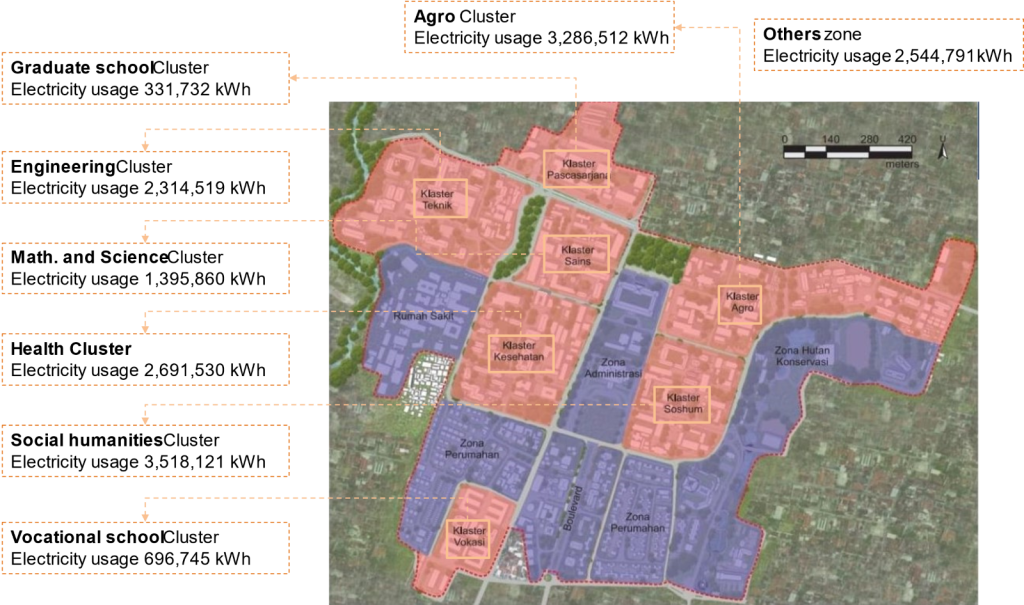
The chart below illustrates electricity consumption across various faculties and clusters at UGM over the past three years (2021–2023). Overall, there has been a notable increase in energy consumption each year. In 2021, electricity usage was relatively low across the campus due to reduced activity levels during the COVID-19 pandemic.
In 2023, UGM experienced a significant 33.58% rise in energy consumption, driven by the operation of 10 new buildings, each with a minimum of five floors, funded through a loan from JICA. This increase can also be attributed to the larger student body and the resumption of in-person campus activities, resulting in a higher demand for electricity. The largest increases were seen in the social and agro clusters, where energy usage more than doubled. The health cluster recorded a 24.78% increase, while the agro cluster saw an 18.31% rise. Other clusters showed minor fluctuations, with slight increases or decreases depending on their respective activity levels.

Among the faculties, the social cluster and agro cluster recorded the most substantial growth in energy usage, with the social cluster rising from 1,012,545 kWh in 2021 to 3,518,121 kWh in 2023 and the agro cluster increasing from 1,763,680 kWh to 3,286,512 kWh over the same period. The health cluster also saw consistent growth, from 2,120,940 kWh in 2021 to 2,691,530 kWh in 2023, reflecting the resource-intensive nature of its activities. Similarly, the engineering cluster demonstrated significant usage, reaching a peak of 2,571,738 kWh in 2022 before slightly declining to 2,314,519 kWh in 2023.
The energy consumption of the graduated school, maths and science cluster, and vocational cluster showed steady increases, reflecting the expanding scope of activities. Notably, the “others zone” saw its energy usage more than triple, from 783,360 kWh in 2021 to 2,544,791 kWh in 2023, underscoring the impact of new infrastructure and activities in previously less-utilised spaces.

From a cluster perspective, the highest energy consumption occurred in the health and engineering clusters, driven by the presence of laboratories and by being the location of UGM’s largest student body. This pattern indicates that the rise in consumption is not due to energy waste but corresponds to the nature and intensity of activities in these clusters.
Moreover, UGM’s electricity usage per capita remains efficient, with an average of 237.24 kWh per person annually—well below the maximum benchmark of 279 kWh. This performance aligns with UGM’s strong commitment to energy conservation, as evidenced by its ranking of 30th out of 1,183 universities worldwide in the UI GreenMetric Rankings. UGM’s participation in the UI GreenMetric Rankings reflects the university’s ongoing dedication to sustainable energy management and environmental responsibility.
References:
